Image of the day

Captured by
james carter

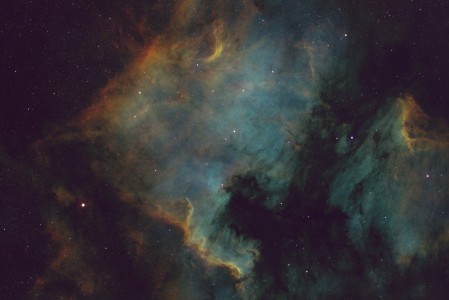
North American Nebula NGC7000

My Account

New to Astromart?

Register an account...

Need Help?

Test Results on Secondary

Started by fblue, 06/18/2004 08:14PM
Posted 06/18/2004 08:14PM Opening Post
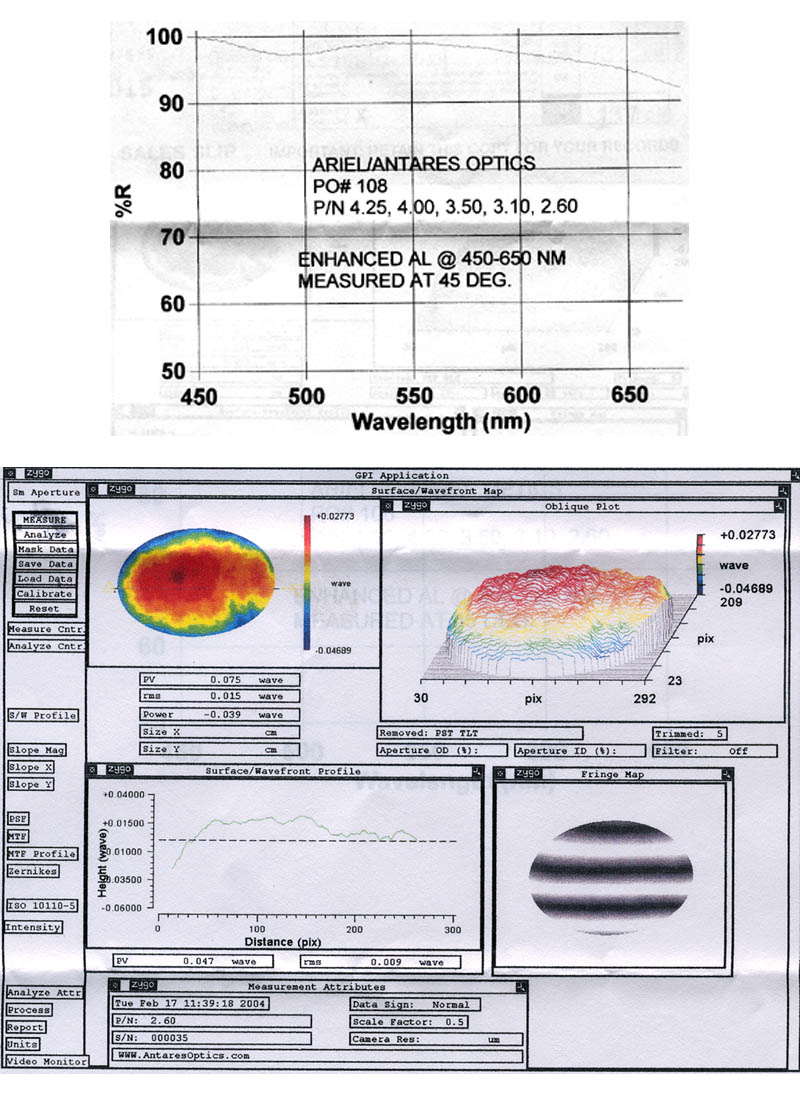
Can anyone interpret these test results into a real idea of the Strehl value or quality.
I see wave value in PV and RMS, but I also notice a bit of a low spot on one end of the mirror. I understand that this is a small area and depth is minimal. I just am not sure how to interpret the test results. the numbers seem to show a 1/13.3 wave PV and a 1/66 wave RMS. Is this correct or am I missing something?
Floyd
Attached Image:

fblue's attachment for post 16806

[SIZE="Large"][/SIZE][COLOR="Blue"][/COLOR] Floyd Blue grin
Amateur Imager
Posted 06/18/2004 11:06PM #1
Floyd,
You are interpreting it correctly, it is 1/13.3 wave peak to valley. As far as predicting the effect on the Strehl ratio I'm not sure I can do that, it will depend on how much of the area of this flat the axis uses. I would guess that the axial area on the flat is probably near twice as good as the total PV. One thing to keep in perspective is that the certified flatness of the transmission flat is only 1/10 or 1/20 wave (Zygo has sold both). My bet is that you'll have a hard time seeing any effects due to this flat even on a night of perfect seeing.
Ed Jones
Posted 06/19/2004 12:07AM | Edited 06/19/2004 12:08AM #2
You are interpreting correctly, though the linear profile is leading to some erroneous generalization: the 'low point' isn't actually at one end, but around most of the edge, this can be seen from the two-dimensional color-coded profile at upper left. This is fairly typical, i.e. a bit of a 'turned edge' to the flat. The edge usually forms the valley of the peak-to-valley. Much of the non-edge surface of the secondary is between 1/30 and 1/40 wave P to V, so depending on how tightly you're sizing the secondary, it's possible that images at the center of the field (the on-axis light cone) will behave closer to 1/30 wave while somewhat off-axis images will perform closer to 1/13 wave. Not that it would be very easy to tell the difference in any case.