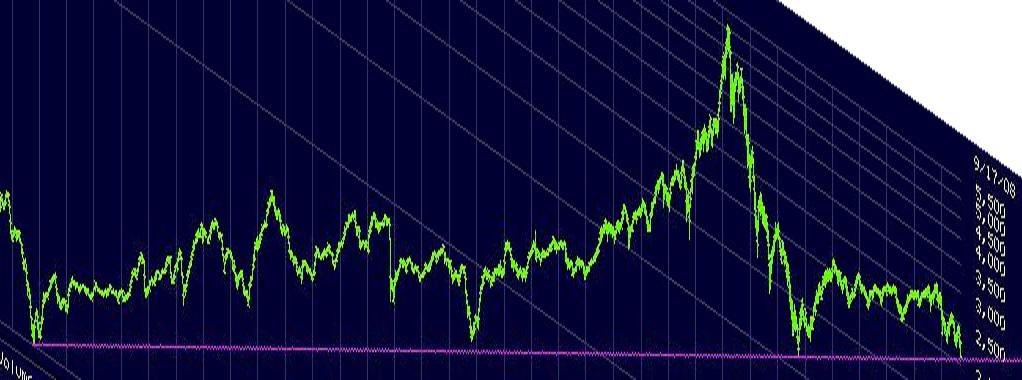
I'm not getting into predicting whether we're going into a depression or not, I'm just putting the current long-term trend stuff out there -- the DJIA and the S&P500, are now the most oversold they've been since 1982 relative to the trendline since then. Below is the DJIA (equivalent chart for SP500 looks pretty much same) trend-sheared -- the degree to which we are below the trendline is roughly on par with the degree of deviation represented by the 'super-recession' of 1982.
Now, while this implies that things are indeed exceedingly bad, we are not yet 'outside the envelope' of the 26 to 35-year trends -- implying that the situation is still within the realm of salvageability. If we do get outside that envelope, then some pretty ugly scenarios are in play and the next oversold extremis is based on the 80-year trendline, which puts the downside for the DJIA somewhere around 3500-4500 level.
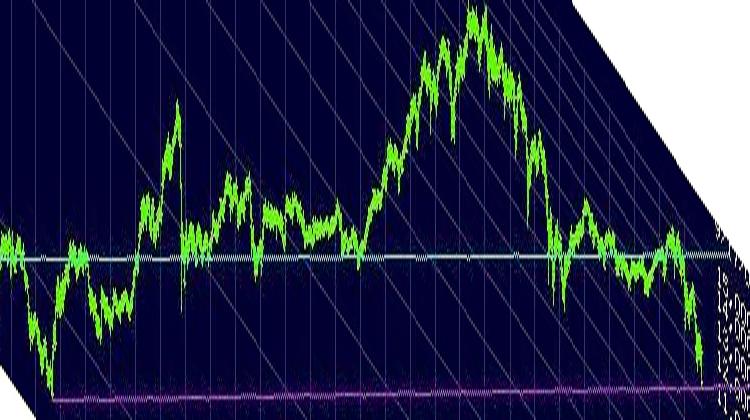
Now, while this implies that things are indeed exceedingly bad, we are not yet 'outside the envelope' of the 26 to 35-year trends -- implying that the situation is still within the realm of salvageability. If we do get outside that envelope, then some pretty ugly scenarios are in play and the next oversold extremis is based on the 80-year trendline, which puts the downside for the DJIA somewhere around 3500-4500 level.
Attached Image: