
Hi all,
Well, I did some more logging last night with different settings for the guiding to find a best case scenario.
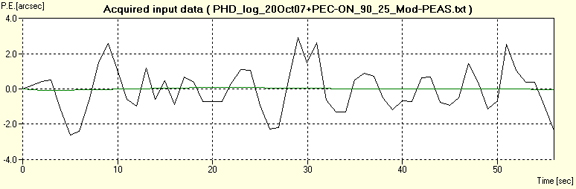
I also found a program that would convert the PHD logs to a readable graph in arc seconds. This make it a bit easier to see the trend and curve as well as the actual PE in during the worm period.
Here is a graph of the PE for 1.34 worm cycles, 322 seconds of tracking. The graph shows this as 100 seconds but that is due to my inability to figure out how to change the 1 sec interval it has for the default.
The red line shows the smoothed curve trend for the PE.
The results show just about the same PE in arc seconds that I had thought, 4.3-4.9 arc seconds peak to peak. This is a pretty good result I believe and I am happy with this.
Well, I did some more logging last night with different settings for the guiding to find a best case scenario.
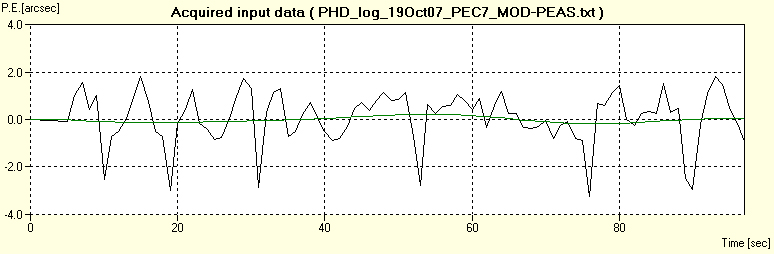
I also found a program that would convert the PHD logs to a readable graph in arc seconds. This make it a bit easier to see the trend and curve as well as the actual PE in during the worm period.
Here is a graph of the PE for 1.34 worm cycles, 322 seconds of tracking. The graph shows this as 100 seconds but that is due to my inability to figure out how to change the 1 sec interval it has for the default.
The red line shows the smoothed curve trend for the PE.
The results show just about the same PE in arc seconds that I had thought, 4.3-4.9 arc seconds peak to peak. This is a pretty good result I believe and I am happy with this.
Attached Image:
[SIZE="Large"][/SIZE][COLOR="Blue"][/COLOR] Floyd Blue

Amateur Imager