
I did some PEC training with the GM-11 and recorded a 5 hour imaging run. The graph is of a single worm period. All 5 hours looked just the same, with only a jump where I changed filters on the wheel.
The chart was created with PEAS to show the results in Arc Sec. If it were stretched it would even look smoother, but this is about 140 different corrections shown in this small graph. The timing was 1.5 sec for each guide frame taken and each is shown here as 1 sec because I can not seem to make PEAS change the default time frame.
Looks like 4 arc sec PE is the norm now.
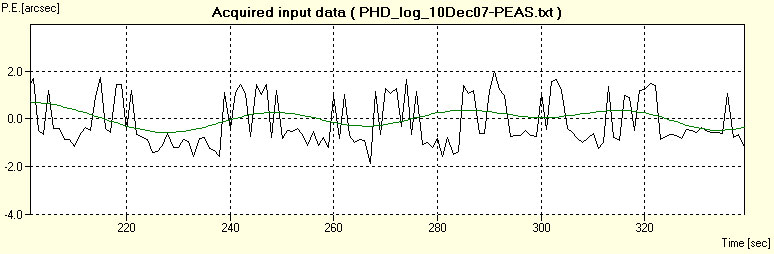
The chart was created with PEAS to show the results in Arc Sec. If it were stretched it would even look smoother, but this is about 140 different corrections shown in this small graph. The timing was 1.5 sec for each guide frame taken and each is shown here as 1 sec because I can not seem to make PEAS change the default time frame.
Looks like 4 arc sec PE is the norm now.
Attached Image:
[SIZE="Large"][/SIZE][COLOR="Blue"][/COLOR] Floyd Blue

Amateur Imager