Image of the day

Captured by
Philip Imbrogno

Jupiter

My Account

New to Astromart?

Register an account...

Need Help?

Posts Made By: Dean Rowe

January 27, 2010 02:25 AM Forum: Global Warming - REAL or NOT

Study shows poorly sited US stations biased!

Posted By Dean Rowe

A study in print in the Journal of Geophysical Research - Atmospheres:
On the reliability of the U.S. Surface Temperature Record
http://www1.ncdc.noaa.gov/pub/data/ushcn/v2/monthly/menne-etal2010.pdf

analyzed the stations as ranked by Anthony Watts' (http://wattsupwiththat.com/) surfacestations.org project comparing both unadjusted and homogenized data from good and poorly sited stations as classified by surfacestations.org. They also cross checked this against the more modern & redundant (multiple instruments at each site) USCRN network.

And they found that the poorly sited stations (a large majority) showed bias ...

So why are the "skeptics" so quite about this? After all, wouldn't this something they'd be all over?

Well, perhaps that's because the poor sites (you know, the ones next to buildings, air conditioners and such that the "skeptics" are always pointing out) showed a cooling bias.

Ooops!

OK - to be clear, the poor stations showed slightly higher minimum temps and cooler maximum temps.

So what's up with that? Well, it turns out that the poor sites are predominancy use MMTS electronic sensors whose relatively short cables required them to be installed near the building where the indoor reading units are located. The good stations mostly use Liquid in Glass (LiG) thermometers - you know, the manually read kind - that didn't require them to be installed near buildings. It is well known that MMTS will read lower than LiGs, that in combination with the fact that when stations switched from LiG to MMTS, they also changed the time of reading from afternoon to morning. These two factors are thought to be the main reason for the bias.

BTW - it's these type of known biases that are why the station data is homogenized - to correct for artificial (non-climatic) changes.

One last item - as much as I give "skeptics" grief, I saw at least one pro-AGW blog (DeSmog Blog) get it wrong here:
Urban Heat Island Myth is Dead
http://www.desmogblog.com/urban-heat-island-myth-dead

This really has nothing to do with the Urban Heat Island (UHI) effect but rather is about micro site influence. UHI is real (and corrected for in - you guessed it - homogenization) caused by large-area urban development. Micro site influence is very localized (a building, parking lot etc).
February 13, 2010 05:24 PM Forum: Global Warming - REAL or NOT

What happened to the cold winter??

Posted By Dean Rowe

"Skeptics" have been all abuzz here lately about the huge snowstorm in the northeast US and the recent extreme cold temps. in parts of the US, Europe and Russia.

Makes you think the world is in for a record setting cold winter right?

Highly unlikely.

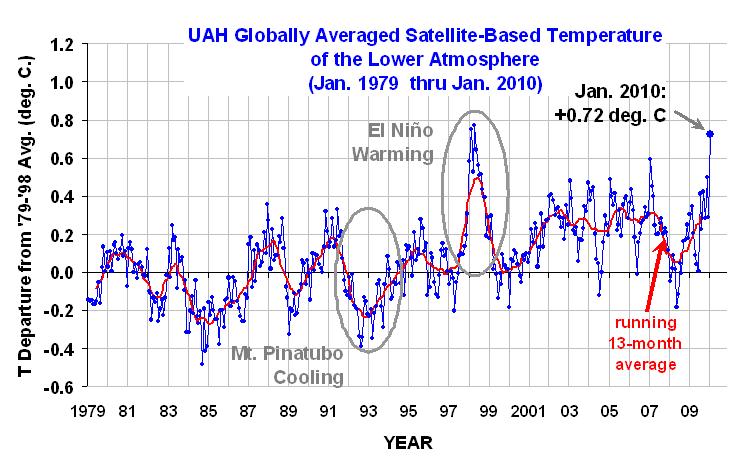
According to Dr. Roy Spencer the UAH satellite data showed last January was:
... the warmest January in the 32-year satellite-based data record.


http://www.drroyspencer.com/2010/02/january-2010-uah-global-temperature-update-0-72-deg-c/

Huh?

The reason for this apparent disconnect is that while it was indeed very cold in some parts of the world, it was also very warm in others:


(RSS MSU satellite anomalies for 01/2010).

You can see how high pressure over the arctic "pushed" cold air down to parts of the US, Europe and Russia, but was replaced by warmer air in the arctic. Much of the rest of the world was much warmer as well.

Does this put a damper on the "skeptics" claims that the last 10 years or so show cooling, that global warming has stopped or that we are headed for another ice age? Well, sorta, but it was a flawed argument to begin with - the time frame is too short to determine the long trend from the short term variation (as I have said many times here). Likewise, jump in January temps (and the increases through 2009 as well) do not by themselves say much about the long term trend for the same reason.

To illustrate, here's the trends for UAH with the 95% statistical confidence ranges. This is a plot of the trends and conf. ranges for each month to the last UAH value (12/1978 to 01/2010, 01/1979 to 01/2010 and so on). What this shows is that the shorter the time frame, the greater the uncertainty of the trend - and the trend gets wilder too. For 11/2009 to 01/2010 the trend was a whopping 13.62 C per decade (133 C per decade - we're gonna fry!) but the uncertainty puts the range anywhere between -25 C per decade (we're gonna freeze!) and 52 C per decade (we're gonna fry really fast!).


I put that together pretty quick and it doesn't take many things into account that would make it more accurate like accounting for autocorrelation and removing sources of noise like ENSO and volcanoes, but it's good enough to give the general idea of how the time period used impacts the confidence. What this doesn't do is show when the trend becomes statistically significant - you don't start seeing that until somewhere around the mid eighties or so. That's why using 30 years is a pretty good rule of thumb.

February 21, 2010 09:03 PM Forum: Global Warming - REAL or NOT

Record January temp due solely to El Nino?

Posted By Dean Rowe

On this thread:
http://www.astromart.com/forums/viewpost.asp?forum_post_id=702040
where I pointed out that last January was the warmest January of the UAH satellite record, Dave replied changing the subject to "Its called "El Nino""

No doubt that El Nino played a big role in the recent uptick, but can the whole thing be attributed to El Nino?

Well, there's a bit of a problem with that - the El Nino hasn't been a particularly strong one, and no where near as strong as the 1998 El Nino.

Here's a plot of the UAH temps over the whole 32 year UAH record and the Southern Oscillation Index (SOI). Pay particular attention to the spike in temps and SOI around 1998 and then look at where they are now and leading up to now - see the problem? While temps and SOI go up and down at about the same times, the temps have this habit of getting progressively higher - clearly there's more than just El Nino & La Nina going on here...


Note: Excel put the date labels are above zero for SOI but below zero for UAH making the SOI look lower if you use the labels as a reference.

March 21, 2010 05:26 PM Forum: Global Warming - REAL or NOT

ENSO & temps revisited & a record for 2010?

Posted By Dean Rowe

Back in June I did a comparison of ENSO (La Nina & El Nino) and temperature anomalies (RSS satellite and HadCRUT). At the time, we were just coming out of a La Nina - since we're now at or just past the peak of an El Nino I figured it was a good time to revisit the topic.

The original thread is here:
http://www.astromart.com/forums/viewpost.asp?forum_post_id=664243

There were lots of (civil - thanks Hugh) comments and we looked at the PDO as well, compared to HadCRUT for a longer view since the satellite temps only go back to 1979, and did some long (50 year) smoothing which showed a multidecadal oscillation. I'm not going to rehash everything discussed there with this post, but if someone wants to look at something, we can go there. I put together something new here - adding an offset to account for the lag between ENSO and temps. Also, rather than inverse the SOI as I did in the last tread, I reversed the order of the Y axis for the SOI (because negative SOI indicates El Nino and warm temps and positive indicates La Nina and cool temps).

From the old thread, here's the 12 month smoothed SOI and detrended RSS temp anomalies with the major volcanic eruptions of Chichon & Pinatubo which depressed temps for a year or so:

http://img199.imageshack.us/img199/715/ensorss.jpg

And the same chart with detrended RSS temp anomalies updated to current conditions - since we've since entered an El Nino, temps have risen since the last chart:

http://img442.imageshack.us/img442/6523/ensorssdtrend12monthavg.jpg

Now for something new. Research has show that there is very good evidence that the ENSO takes about 6 months to influence temps, so what I did here was "shift" the SOI forward by six months. 12 months smoothing helps remove some of the variation, but its too show changes over a few months, so what I did was use 3 month smoothing (originally for no other reason than the SOI has to be over/under plus/minus 0.5 to "officially" be called La Nina/El Nino). The resulting matchup is very interesting:


http://img413.imageshack.us/img413/3008/ensorssdtrend3monthavgo.jpg

So, except for the major volcanic erruptions, there is a very good match up with SOI and temps indicating that ENSO has a very major influence on temp variations.

Note that I said variations and not climate. The reason is that the above charts have detrended the RSS data which took out the rise in temp anomalies to show the match in variation. Using untrended RSS data shows that there is an upward trend in the RSS data that is not related to ENSO


http://img175.imageshack.us/img175/1152/ensorss3monthavgoffset.jpg

Now, you may have noticed something about the 3 month charts - if the temp anomalies do follow ENSO by six months, then they would seem to indicate that temp anomalies still have some catching up to do, so should we expect 6 more months of increasing temp anomalies? With that in mind, the record year for RSS (1998) had an average temp anomaly of 0.551C while 2010 so far has an average of 0.614C. This very thing has many talking that 2010 is likely to be a record year:

NASA: "It is nearly certain that a new record 12-month global temperature will be set in 2010"
http://climateprogress.org/2010/03/19/nasa-giss-james-hansen-global-warming-record-hottest-year/

Yeah, I know that's Climate Progress - I linked to their enthusiasm to throw a bit of cold water on that idea.

Look at it this way - for RSS to set a record in 2010, it has to have an average anomaly over 0.614C. So far it has had 0.640C and 0.588C - to put in perspective what it would take to break the record - it will have to average over 0.538C for the rest of the year. With that in mind, here's the monthly SOI offset by 6 months and RSS anomalies:


http://img260.imageshack.us/img260/8348/ensorssmonthlyoffset.jpg

The problem is that RSS has only been over 0.538C for the last two months and while it seems it may go up over the next few months, the El Nino has shown some indication of recent weakening (it resurged in January & February but is weaking again in March). It seems to me unlikely that the El Nino will last more than a few more months, and the surge in temps in Jan & Feb look to have "overshot" the ENSO influence. Considering that, my take is that unless the El Nino holds up longer than say 3 months, I doubt that RSS will break a record in 2010. I haven't looked at GISS and HadCRUT, but seeing that El Nino gooses the satellite temps more than it does the surface temps, I would guess they won't either (but again I haven't looked at them).

January 5, 2008 12:25 AM Forum: CCD Imaging and Processing/Deep Sky

Wide Field Hydrogen Alpha Grab Bag in Cas

Posted By Dean Rowe

That's a great deep shot Rob! I've shot SH2-157 and the bubble, but I didn't realize there was all that stuff to the lower right.

February 9, 2008 02:36 PM Forum: CCD Imaging and Processing/Deep Sky

A work in progress on Rosette!

Posted By Dean Rowe

Awesome Luca! The only suggestion I would make is to keep it up!

April 9, 2009 04:12 PM Forum: Global Warming - REAL or NOT

Polar Ice Extent update - North and South

Posted By Dean Rowe

Doug Peterson said:

" ... Meanwhile in the Arctic, sea ice area is about 500,000 km2 below normal, which means that global sea ice area (Arctic + Antarctic) is about 500,000 km2 above normal."


http://wattsupwiththat.com/2009/04/08/polar-ice-worries-north-and-south/#more-6868

So? This is just what the IPCC report says the current models project:

http://www.ipcc.ch/pdf/assessment-report/ar4/syr/ar4_syr.pdf
P. 47


Current global model studies project that the Antarctic ice sheet will remain too cold for widespread surface melting and gain mass due to increased snowfall. However, net loss of ice mass could occur if dynamical ice discharge dominates the ice sheet mass balance.
{WGI 10.7, SPM}


May 7, 2009 03:56 PM Forum: Global Warming - REAL or NOT

Hansen & IPCC Models Shown False, Again

Posted By Dean Rowe

From the WUWT blog:


Whether the anthropogenic global warning hypothesis is invalid or merely incomplete, the time has come for serious debate and reanalysis. Since Dr. Pielke first published his challenge in 2007, no critical attempts have been made to explain these failed projections. His blogs have been greeted by the chirping of crickets. In the mean time costly political agendas focused on carbon mitigation continue to move forward, oblivious to recent empirical evidence. Open and honest debate has been marginalized by appeals to consensus. But as history has often shown, consensus is the last refuge of poor science.

If Pielke and DiPuccio really want "Open and honest debate", they would publish in a science journal like Science or Nature instead of WUWT and Pielke's blog. Had Pielke published in the journal Science then his "challenge" might have gotten attention. How many of the scientists who work in this area even know about Pielke's blog not to mention his challenge?

I'm highly skeptical of such grand claims when the claimers avoid the science journals where their work and claims would receive the scrutiny they deserve by the scientists most familiar with the field of wok. I don't know why they choose to avoid the science journals, but I can hazard a few guesses.


May 20, 2009 04:39 PM Forum: Global Warming - REAL or NOT

Global avg temps flat for 10 years--all 4 services

Posted By Dean Rowe

Doug Peterson said:

http://wattsupwiththat.com/2009/05/19/comparing-the-four-global-temperature-data-sets/#more-7943

This exact claim was addressed in a recent article in Geophysical Research Letters

Numerous websites, blogs and articles in the media have claimed that the climate is no longer warming, and is now cooling. Here we show that periods of no trend or even cooling of the globally averaged surface air temperature are found in the last 34 years of the observed record, and in climate model simulations of the 20th and 21st century forced with increasing greenhouse gases. We show that the climate over the 21st century can and likely will produce periods of a decade or two where the globally averaged surface air temperature shows no trend or even slight cooling in the presence of longer-term warming.

http://www.cdc.noaa.gov/csi/images/GRL2009_ClimateWarming.pdf

Also, your article picks a time range that starts during an El Nino and ends during a La Nina as can be seen here:


In other words, cherry picking a peak of the ENSO for the start and trough for the end. That's like standing just offshore trying to determine if the tide is coming in or going out by measuring the depth of the water and then saying the tide must be going out because the water level is lower just after a wave passed by.

May 22, 2009 03:52 PM Forum: Global Warming - REAL or NOT

The Ten Myths of Global Warming

Posted By Dean Rowe

Dave Snope said:
Ice is spreading in Antarctica

Which is what the 2007 IPCC report said the climate models projected:

Current global model studies project that the Antarctic ice sheet will remain too cold for widespread surface melting and gain mass due to increased snowfall. However, net loss of ice mass could occur if dynamical ice discharge dominates the ice sheet mass balance.
{WGI 10.7, SPM}

http://www.ipcc.ch/pdf/assessment-report/ar4/syr/ar4_syr.pdf
Page 47

Rather interesting spin to try and say that something happening as predicted is contradictory.

Oh, and I addressed "Myth 1" in your link with my post here:
http://www.astromart.com/forums/viewpost.asp?forum_post_id=662735&poll_id=&news_id=&page=

where you responded, but totally avoided addressing my points on this very item. Did you know these "tactics" of yours have a name? It's called the Gish Gallop:
http://rationalwiki.com/wiki/Gish_gallop