Image of the day

Captured by
Ralph Ford

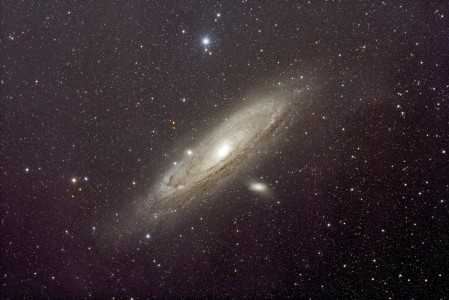
M31 with Redcat 51

My Account

New to Astromart?

Register an account...

Need Help?

Posts Made By: Dean Rowe

December 2, 2009 10:56 PM Forum: Global Warming - REAL or NOT

Phil Jones steps down, Michael Mann investigated

Posted By Dean Rowe

Doug Peterson said:

Maybe there is a god.

http://www.washingtonpost.com/wp-dyn/content/article/2009/12/01/AR2009120102737_pf.html

http://www.usnews.com/blogs/paper-trail/2009/11/30/penn-state-will-investigate-climategate.html

But what if they are acquitted of any wrong doing - would you accept that?

My guess is that Jones won't be back as director of CRU.

As for Mann - I doubt there were will be any finding of wrongdoing. At worse, he may receive a reprimand for some questionable practices related to trying to influence peer review.

That's my guess. Maybe we should start a pool?

December 3, 2009 10:18 PM Forum: Global Warming - REAL or NOT

Hiding The 1940s Blip

Posted By Dean Rowe

Dave Snope said:
What I discovered surprised even me. Of all the countries graphed out in the CRU ‘raw’ data, 75% showed a peak-to-peak difference less than 0.5°C – which means they was no significant climate change for three quarters of the world’s land measurements.

Actually what it means is he has nothing of any statistical significance at all. You can not determine the slope or trend of a set of data points using (eyeball?) measurements of "peak-to-peak difference" - you need to use something like a linear regression.

C'mon Dave, is this all you're able to come up with???

December 17, 2009 02:00 AM Forum: Global Warming - REAL or NOT

Another recent example of data doctoring exposed

Posted By Dean Rowe

The Moscow-based Institute of Economic Analysis? Color me skeptical.

So riddle me this - if the CRU has faked the data as much as you guys say, then why does HadCRUT temperature data agree so well with UAH satellite data (which you guys love so much) over the entire 30 year UAH record? Did John Christy and Roy Spencer fake their data too?


Since the UAH data is entirely from satellites and has no connection whatsoever to how the surface record is gathered and processed, how do you explain such close agreement?

On top of that, the other satellite record, RSS, shows a high level of warming over the same area of Russia that the CRU data does:


Did RSS fake this too??

December 21, 2009 12:35 AM Forum: Global Warming - REAL or NOT

RealClimate, Wikipedia & Climategate emails

Posted By Dean Rowe

Connolley doesn't think much of Solomon's piece (I'm sure that's a surprise)

http://scienceblogs.com/stoat/2009/12/i_am_all_powerful_part_2.php

January 5, 2010 03:05 PM Forum: Global Warming - REAL or NOT

Flawed Process

Posted By Dean Rowe

Judson Mitchell said:
Has anyone seen anthing else from the AGW community further explaining the data problem other than saying "the process was flawed, but the conclusions are valid"?

I'm not sure just what supposed "data problem" you're refering to, but most of what I hear from "skeptics" is either unfounded or distorted. On the few occasions they point out a real flaw, it invariably turns out to be insignificant.

Here's a recent example where Doug posted a link to WUWT, charging that:
... the Russian surface station data was sorted by CRU to use the highest warming stations only

http://www.astromart.com/forums/viewpost.asp?forum_post_id=693700&poll_id=&news_id=&page=

But raised the point here:
http://www.astromart.com/forums/viewpost.asp?forum_post_id=693736&poll_id=&news_id=&page=

That IF that's true then why does the CRU data match so well with the UAH satellite data? That's kinda hard to explain if there's a CRU "data problem". I notice the only explaination offered was your guess that CRU was fudging the data to match the satellites.

Notice that I didn't say the "process was flawed" - in fact my response shows good reason to think the "process" is pretty darn sound.

January 7, 2010 04:18 AM Forum: Global Warming - REAL or NOT

Is global warming overestimated?

Posted By Dean Rowe

Uh-huh. He all-so-conveniently uses the USHCN data set which only covers the US and has a very low trend of 0.06 C per decade. Even the UAH satellite data (usually so preferred by skeptics over surface records like, um, the USHCN) has a trend twice that at 0.127 C per decade.

I suspect he really chose USHCN because it shows such a low trend. It's no secret that the PDO, ENSO and such have a major influence on variation, but not so much long term trends (I did a post on just that showing the influence of ENSO & PDO on temp variations). Had he used one of the global sets, he would have had a hard time explaining how the temp data had an inconvenient habit of rising above the fluctuations. When I plotted the RSS satellite temp. data against ENSO and PDO here:
http://www.astromart.com/forums/viewpost.asp?forum_post_id=664774
I had to remove the tend from the RSS data first to keep it in line with the ENSO & PDO data - if I hadn't the RSS temp data would have risen above the ENSO & PDO lines as can be seen here in a plot I did of RSS & ENSO where the RSS data wasn't detrended:
http://img33.imageshack.us/img33/2896/ensorsstrended.jpg

January 12, 2010 12:46 AM Forum: Global Warming - REAL or NOT

Climate Scientists: 20-30 Year Ice Starts Now

Posted By Dean Rowe

Dave, the very scientist cited in your article disagrees:

"Leading climate scientist challenges Mail on Sunday's use of his research"
http://www.guardian.co.uk/environment/2010/jan/11/climate-change-global-warming-mojib-latif

You must be pretty embarrassed that the very source you referenced for authoritative support disagrees with you.

January 16, 2010 02:58 PM Forum: Global Warming - REAL or NOT

NOAA Data Manipulation Exposed

Posted By Dean Rowe

This is just a rehash of the Darwin nonsense - that's been debunked several times, like here:
http://scienceblogs.com/deltoid/2009/12/willis_eschenbach_caught_lying.php

It's no secret that the data gets adjusted - Eschenbach in the Darwin example and D’Aleo in your link fail to mention that there are documented reasons for data adjustments:

In the case of Darwin:
http://reg.bom.gov.au/amm/docs/2004/dellamarta.pdf

NOAA:
http://www.ncdc.noaa.gov/oa/climate/research/ushcn/ushcn.html#QUAL

CRU:
http://www.cru.uea.ac.uk/cru/data/temperature/HadCRUT3_accepted.pdf

I posted the CRU link earlier along with 4 examples that didn't show skewness in the CRU dataset here:
http://www.astromart.com/forums/viewpost.asp?forum_post_id=696634&poll_id=&news_id=&page=
But I guess you missed that since you had no comment.

NOAA has also published how they adjust data here:
http://www.ncdc.noaa.gov/oa/climate/research/ushcn/ushcn.html#QUAL

One type of adjustment made, according to the Australia's BOM publication, was to compensate for changing to Stevenson screens which cause an "approximate 1°C drop in maximum temperatures".

The problem with Eschenbach and D’Aleo is that they seem to think these sorts of things that are known (and documented and published) to artificially affect the temperature record should just be left alone - and in the case of the Stevenson screens introduce a cooling bias. On top of that, they don't seem to want to even tell you about them, rather they just point at a station and say look - they adjusted the temps up - must be fraud! That is nothing short of flat out dishonesty.

This isn't the first time "skeptics" resorted to this level dishonesty -
http://www.climateconversation.wordshine.co.nz/docs/are_we_feeling_warmer_yet.pdf
presented stations as singular, continous records even though there were significant station moves:
http://www.niwa.co.nz/news-and-publications/news/all/niwa-confirms-temperature-rise/combining-temperature-data-from-multiple-sites-in-wellington
on top of that, according to NIWA, the NZCSC had access to the raw data despite their claims otherwise:
http://www.niwa.co.nz/news-and-publications/news/all/nz-temperature-rise-clear

3. NZ Climate Science Coalition disingenuous

For more than two years, New Zealand Climate Science Coalition members have known of the need to adjust the seven station data. They have had access to:

* the raw data
* the adjusted data (anomalies)
* information needed to identify the adjustments made by Dr Salinger
* information needed to develop their own adjustments.

As I posted before, I'm less than impressed when "skeptics" post a single station and yell "look, they adjusted the temps up - FRAUD". When you pull back the covers even just a little bit, you see that this is nothing more than yet another dishonest and deceptive smear attempt (I've been subject to such a smear attempt right here on AM) - and you quite gullibly repeat this, uncritically dropping your supposed skepticism.

The reasons and methods for the adjustments have been published - I've just given you links to several. If "skeptics" want to have any hint of credibility, then they really need to at least acknowledge that reasons for adjustments exist, that this information is and has been publicly available for some time. Simply pointing to a change to a station's data isn't going to cut it - you really need to show that the adjustments were not in line with the published reasons & methods or show that those reasons and methods are flawed - to do otherwise reeks of fraud on part of the "skeptics".
January 18, 2010 03:02 PM Forum: Global Warming - REAL or NOT

If You Torture The Data Long Enough...

Posted By Dean Rowe

That's not showing what you think it is Dave - it's showing raw and after the homogeneity adjustment.

Whats really funny is that after the homogeneity adjustment, the amount of warming shown was actually reduced - contrary to what "skeptics" keep telling us about these adjustments. I guess those guys at GISS didn't get the memo that their adjustments are supposed to increase warming.

Here's that station after "raw GHCN data+USCN corrections"

Here it is "after combining sources at the same location"

And then "after homogeneity adjustment" (Oops - the warming went down!)

You can check it out yourself here:
http://data.giss.nasa.gov/gistemp/station_data/
Select which dataset you want, search on Stanley and select station ID 425727410010

January 19, 2010 10:29 PM Forum: Global Warming - REAL or NOT

Homogenized Data Has 4X Temperature Trend

Posted By Dean Rowe

Dave Snope said:

What this shows is that on average the adjustment process more than quadrupled the trend in raw temperatures, increasing the trend of the mean from 0.0113 for raw data to 0.0536. Indeed, if the mean trend change of 0.0423 resulting from adjustments to the long record stations were typical of the effect of adjustments to station data generally, the adjustment process would account for a substantial proportion of the recorded global mean temperature increase over the twentieth century.

Um - no, for two reasons.

First he just combined stations without regard to their geographic distribution so his analysis is heavily skewed to over represent those areas with the most stations (which would be the US). That's why "global temps" are calculated with a gridded system.

The second is right in front of you. Here - I underlined it for you:

See it? His slope or trend is much less than his error range. When you take his error range into consideration then:
raw ranges from -0.0854 to 0.112 (0.0133 plus or minus 0.0987)
adj ranges from -0.0394 to 0.1466 (0.0536 plus or minus 0.093)
To illustrate - here's a chart showing how the ranges overlap:

So as you can see, they overlap more than they don't - meaning that at most the best you can say is the difference between the two slopes is statistically indistinguishable.

So he has no basis at all (on two points at that) to say this can account "for a substantial proportion of the recorded global mean temperature increase over the twentieth century"