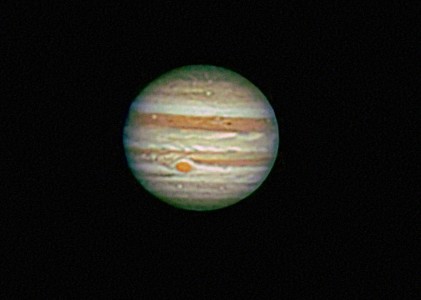
Image of the day

Captured by
Philip Imbrogno

Jupiter

My Account

New to Astromart?

Register an account...

Need Help?

Posts Made By: Dean Rowe

December 29, 2007 03:11 PM Forum: CCD Imaging and Processing/Deep Sky

Flaming Star and Friends in Ha

Posted By Dean Rowe

First time posting over here.

IC405, IC410 & IC417

With snowstorms and the holidays, I haven't gotten much imaging in lately. So when it looked to be clear last night, I didn't mind the 0F temperatures, 20 mph winds and horrid seeing last night.

http://deanrowe.net/astro/?image=images/ic405_etal

January 5, 2008 12:20 AM Forum: CCD Imaging and Processing/Deep Sky

Thar she blows! IC443 Ha wide field

Posted By Dean Rowe

I've wanted to do a wide shot of the Jellyfish for some time. I knew the nebula above it was pretty extensive and looked kind of like a whale spouting, but I didn't realize it had such prominent dark lanes.

http://deanrowe.net/astro/?image=images/ic443_wide

January 17, 2008 02:35 AM Forum: CCD Imaging and Processing/Deep Sky

Orion's Ego

Posted By Dean Rowe

Orion's sword and belt are popular areas, so to go off the beaten track a bit I went for his head: SH2-264 in Ha. Orion must have had quite an ego - this thing is huge! I used the Epsilon 180 and STL11K which has a FOV of 245x168 minutes or about 4x2.8 degrees and still could only get about 1/4 of it (the NW 1/4)

http://deanrowe.net/astro/?image=images/sh2_264

January 28, 2008 01:51 AM Forum: CCD Imaging and Processing/Deep Sky

LDN 1622 & Barnard's Loop in Ha

Posted By Dean Rowe

12 hours worth of 45 minute subs Ha with the Epsilon 180. This is a real dim one - after working the first 6 hours of data, it was still real noisy after I stretched it where I wanted, so I took another 6 hours. Most of the subs were without the moon up, but I did take another 10 hours of data that I didn't use because the moon was too close. I learned that shooting long Ha exposures with the E180 isn't pretty if moonlight gets in.

The cluster near the bottom is NGC 2112 and M78 is partly visible in the lower right corner.

http://deanrowe.net/astro/?image=images/ldn_1622

February 10, 2008 07:00 PM Forum: CCD Imaging and Processing/Deep Sky

M1 HaLRGB

Posted By Dean Rowe

I finally got a night with little wind and was itching to shoot at some longer FLs (I shot in 60mph gusts with the E180 the previous night). The seeing was cruddy, so I went for RGB for the M1 Ha I had shot earlier. The bad seeing made for some really bloated stars, so I didn't bring them out as much as I might have. I would have liked to get the inner cotton-candy structure but it wasn't going to happen with the seeing.

http://deanrowe.net/astro/?image=images/m1_ha

February 13, 2008 04:17 AM Forum: CCD Imaging and Processing/Deep Sky

Southern Barnard's Loop

Posted By Dean Rowe

Another deep Ha of a section of Barnards loop with the Epsilon 180. The brighter clump to the lower right might be LBN 992, but I think that's further west (to the right).

http://deanrowe.net/astro/?image=images/south_barn

May 28, 2009 09:06 PM Forum: Global Warming - REAL or NOT

The stratosphere has been cooling for 30 years!

Posted By Dean Rowe


That's the TLS satellite channel (lower stratosphere) from RSS http://ssmi.com/msu/msu_data_description.html#msu_amsu_trend_map_tls )

But why aren't the skeptics all over this?

Two reasons -
1) Its a predicted result of warming by greenhouse gasses
2) If you're banking on changes in solar output to explain recent increases in the surface temperature, you really don't want to have the stratosphere cooling on you.

The why is simple - the theory that increasing GH gasses will cause global warming depends on the fact that GH gasses trap infra red radiation being radiated from the earth surface - more GH gasses means more IR being absorbed hence increased temperatures.

But that means that the lower atmosphere, with its greater gas concentration and closer proximity to the earth's surface, will absorb more IR radiation from the earth's surface so that less IR makes it to the upper atmosphere (the stratosphere). Decrease the IR reaching the stratosphere and it's going to cool.

Which is what AGW theory predicts - a warming lower atmosphere and a cooling stratosphere.

FWIW - here's what the RSS satellite data (from the same link above) show for the lower atmosphere:


However, if you're betting that increases in the suns output has caused recent warming, then you would want to see the upper atmosphere warming - after all, solar radiation hits the stratosphere before the lower atmosphere and the earth's surface so how could this supposed extra solar radiation pass through the stratosphere and cause the lower atmosphere to warm and yet not warm the stratosphere but actually cause it to cool?

Hmmm - maybe that's why skeptics don't like to talk about the cooling stratosphere?

June 4, 2009 01:15 AM Forum: Global Warming - REAL or NOT

ENSO influence on temperature variations

Posted By Dean Rowe

Here's an interesting chart I just put together - it's a plot of 12 month averages of the Southern Oscillation Index and de-trended RSS temperatures. It's interesting to note how close the ups and downs match up except for the Chichon and Pinatubo eruptions which are marked.

So, when skeptics like to make hay about temps have flattened or dropped since 2003 (or whenever) notice what the SO index was doing. Then consider that we just entered ENSO neutral conditions (neither EL Nino or La Nina) after being in a La Nina and may enter El Nino conditions soon (May's SO index was -5.1 which would be 5.1 on the chart) - so what will the temps do then?

Now, before the skeptics get all excited and try to say "see - its ENSO and not CO2 driving temps" I'll point out that the RSS data has had the trend of about 0.0013 C removed per month (0.0013 for the 1st month, 0.0026 for the second month, etc up to about 0.4684 removed for April 2009). The ENSO data is unaltered because it has no trend (Dave - that means it's "flat"). So the correlation we are seeing here is correlation with the wiggles in the trend, but not correlation with the trend.


I didn't do anything fancy here, it was very simple:
- Reverse the sign of the SO index so that El Nino conditions are positive and La Nina conditions are negative.
- Calculate the per-month slope of the RSS data and subtracted that times the months from the start from the RSS data. This removes the trend from the RSS data so what we have is the variation from the trend (Dave - that makes it "flat").
- Average every 12 month span (01/1979 to 12/1979, 02/1979 to 02/1980 etc)

The ENSO data is from here:
ftp://ftp.bom.gov.au/anon/home/ncc/www/sco/soi/soiplaintext.html
With a brief explanation here:
http://www.bom.gov.au/climate/glossary/soi.shtml

The RSS data is here:
http://www.remss.com/data/msu/monthly_time_series/RSS_Monthly_MSU_AMSU_Channel_TLT_Anomalies_Land_and_Ocean_v03_2.txt


November 13, 2009 02:06 AM Forum: Global Warming - REAL or NOT

Watts Up With That confirms prediction!

Posted By Dean Rowe

As far back in July I made a couple predictions:


I'll make a few predictions:
1) If the El Nino continues to strengthen to be a typical or strong El Nino, temps will rise over the next year or two.
2) The very same skeptics that are now making hay of recent flat or declining temps while ignoring the La Nina will dismiss this rise blaming it on the El Nino. In other words, they will confidently (and dishonestly) point to ENSO influences when it suits their purposes.
[edit - forgot link]
http://www.astromart.com/forums/viewpost.asp?forum_post_id=670356&poll_id=&news_id=&page=

I brought it up again a few days ago here :
http://www.astromart.com/forums/viewpost.asp?forum_post_id=687271&poll_id=&news_id=&page=

with a link to Pure Poison taking bets as to which skeptic would do it and when:
http://blogs.crikey.com.au/purepoison/2009/11/03/hot-weather-proves-nothing-place-your-bets/

Well, it looks like Watts Up With That has confirmed my prediction (even sooner than I expected) with a guest post by Bob Tisdale:


Countdown to an "unprecedented warm decade" - 2 months to go

Global Temperatures This Decade Will Be The Warmest On Record...

...And It Will Be Exploited By Those Who Fail To Understand The Reasons For The Rise

http://wattsupwiththat.com/2009/11/10/countdown-to-an-unprecedented-warm-decade-2-months-to-go/

And the reason given?

[SIZE="Large"]El Nino![/SIZE]

(Hmmmm - rather interesting, especially considering my recent exchange with Doug)

OK, in fairness to Bob Tisdale, his argument is it's really mostly a holdover effect from the 1998 El Nino and he has been saying that for some time, well before the current El Nino started. He does, however, say on his website that he thinks the current El Nino will keep the 2000s from being cooler than the 1990s
http://bobtisdale.blogspot.com/2009/11/global-temperatures-this-decade-will-be.html


January 18, 2010 04:12 PM Forum: Global Warming - REAL or NOT

If "skeptics" would RTFM

Posted By Dean Rowe

One of the things making the rounds with the "skeptics" is the dramatic reduction in the number of surface stations after the 1980s which the "skeptics" allege/imply is evidence of cherry picking stations that show the most warming.
Dave recently posted an example here:
http://www.astromart.com/forums/viewpost.asp?forum_post_id=697619&poll_id=&news_id=&page=
linking to this from D’Aleo at IceCap:
http://icecap.us/images/uploads/NOAAroleinclimategate.pdf
Here's a chart from that document showing the dramatic decline in the station count:

and makes the charge that:

The data is then used for estimating the global average temperature and for initializing climate models. Interestingly the very same often coolest stations that were in last two decades deleted from the world climate network were retained for computing the average temperature base periods for each grid box. This also would indicate a deliberate attempt to create a warm bias on the part of NOAA because in calculating the average temperatures in this way it would ensure that the global average temperature for each month and year would now show a positive temperature anomaly.
The world’s surface observing network reached its golden era in the 1960s to 1980s with more than 6000 stations worldwide providing valuable climate information. It dropped rapidly to 1500 around 1990.

Is this some new revelation they have uncovered?

Well, if D’Aleo had Read The Fine Manual from NOAA published over 12 years ago in 1997 they might have found this:


(solid line are stations with mean temps and dashed line are those with min/max temps)

D’Aleo has uncovered a secret that was clandestinely hidden in the publications of the Bulletin of the American Meteorological Society
"An Overview of the Global Historical Climatology Network Temperature Database"
http://www.ncdc.noaa.gov/oa/climate/research/Peterson-Vose-1997.pdf
where we learn that:
A time series for a given station can frequently be obtained from more than one source. For example, data for Tombouctou, Mali, were available in six different source datasets. When "merging" data from multiple sources, it is important to identify these duplicate time series because 1) the inclusion of multiple versions of the same station creates biases in areally averaged temperature analyses, and 2) the same station may have different periods of record in different datasets; merging the two versions can create longer time series.
The goal of duplicate station elimination is to reduce a large set of n time series (many of which are identical) to a much smaller set of m groups of time series that are unique. In the case of maximum and minimum temperature, 8000 source dataset time series were reduced to 4964 unique time series.
AHA! so NOAA admits that they maliciously removed over 3,000 duplicated stations! The scurrilous reasons for removing the rest of the station data is there too!
[/sarcasm]
If D’Aleo had RTFM from NOAA, he'd see that NOAA laid out the boring reasons 12 years ago for why station data was removed. But hey, that's not as much fun as cooking up conspiracies for the gullible now is it?