Image of the day

Captured by
Arthur Hogan

Iris Nebula

My Account

New to Astromart?

Register an account...

Need Help?

Color curve comparison

Started by RolandC, 11/09/2004 01:53AM
Posted 11/09/2004 01:53AM Opening Post
Hi All,

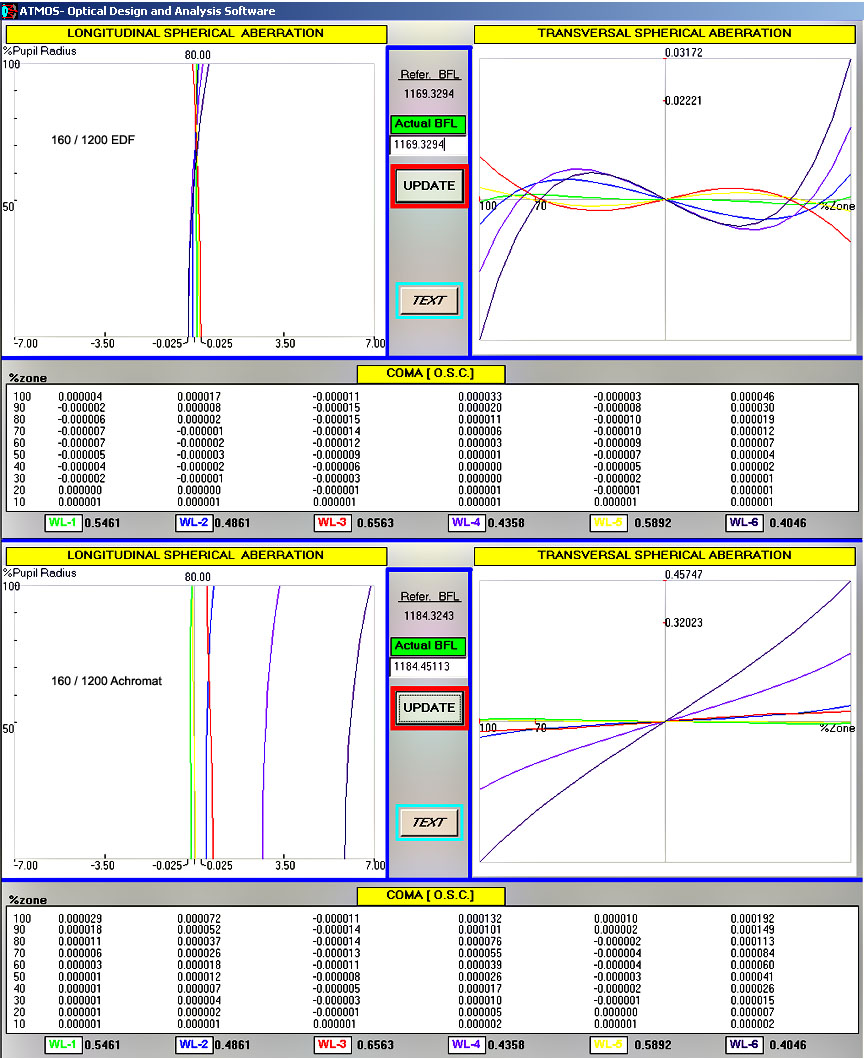
I thought I might post a comparison of the 160 EDF color curves with that of an optimized achromat of the same size, in case anyone is interested. Later I may post a side by side image of the Airy disc at each color to show how these color curves translate into actual images at the eyepiece.

Roland Christen
Attached Image:
RolandC's attachment for post 20042
Posted 11/09/2004 12:18PM | Edited 11/09/2004 12:25PM #1
I take it that the +/- 0.025 labels on the longitudinal
spherical really ought to be +/- 0.25, yes? For the
achro it ought to be 1200/2000=0.6mm focus range C-F lines?

Can you please make a similar plot comparing the AP155
and AP160? I am wondering if AP155 owners might
consider upgrading to the AP160 for purely visual use.
From the specs alone is seems the visual correction in the
160 is about twice as good as the 155 (0.0045% vs 0.01%),
but I take it this is only at the 70% or 80% zone.
I am wondering about other zones -- i.e. if there is more
or less sphero-chromatic in the AP160 than the AP155.
My own crude plots comparing the longitudinal spherical
are somewhat curious.
Posted 11/13/2004 07:34AM | Edited 11/13/2004 07:40AM #2
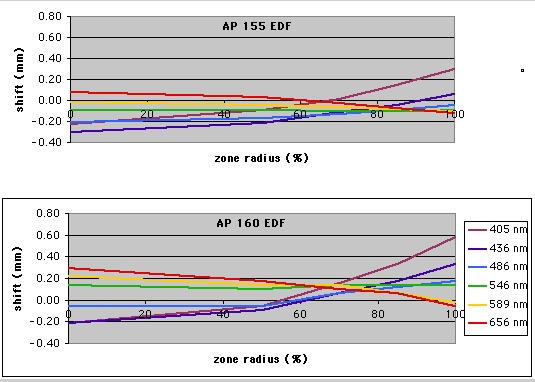
I tried to understand a little bit how the AP160 will
compare vs. AP155. I made a plot with the longitudinal
spherical aberration curves for both on the same scale.
The AP155 data is from the old AP web page; AP160
is from the above graph (assuming units are mm!).

The curves seem rather similar. The AP160 seems to have
less color spread around the 70% zone. There
is a little more color spread outside the 90% zone, but
I am not sure what impact this would have.


Attached Image:

m87's attachment for post 84915