"Skeptics" have been all abuzz here lately about the huge snowstorm in the northeast US and the recent extreme cold temps. in parts of the US, Europe and Russia.
Makes you think the world is in for a record setting cold winter right?
Highly unlikely.
According to Dr. Roy Spencer the UAH satellite data showed last January was:
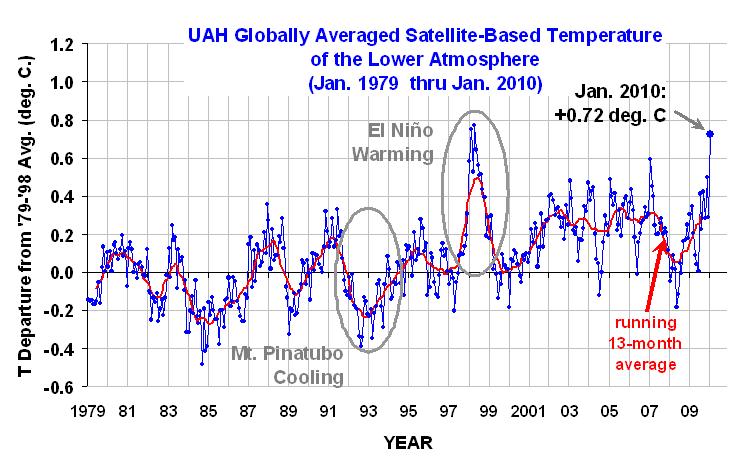
http://www.drroyspencer.com/2010/02/january-2010-uah-global-temperature-update-0-72-deg-c/
Huh?
The reason for this apparent disconnect is that while it was indeed very cold in some parts of the world, it was also very warm in others:

(RSS MSU satellite anomalies for 01/2010).
You can see how high pressure over the arctic "pushed" cold air down to parts of the US, Europe and Russia, but was replaced by warmer air in the arctic. Much of the rest of the world was much warmer as well.
Does this put a damper on the "skeptics" claims that the last 10 years or so show cooling, that global warming has stopped or that we are headed for another ice age? Well, sorta, but it was a flawed argument to begin with - the time frame is too short to determine the long trend from the short term variation (as I have said many times here). Likewise, jump in January temps (and the increases through 2009 as well) do not by themselves say much about the long term trend for the same reason.
To illustrate, here's the trends for UAH with the 95% statistical confidence ranges. This is a plot of the trends and conf. ranges for each month to the last UAH value (12/1978 to 01/2010, 01/1979 to 01/2010 and so on). What this shows is that the shorter the time frame, the greater the uncertainty of the trend - and the trend gets wilder too. For 11/2009 to 01/2010 the trend was a whopping 13.62 C per decade (133 C per decade - we're gonna fry!) but the uncertainty puts the range anywhere between -25 C per decade (we're gonna freeze!) and 52 C per decade (we're gonna fry really fast!).

I put that together pretty quick and it doesn't take many things into account that would make it more accurate like accounting for autocorrelation and removing sources of noise like ENSO and volcanoes, but it's good enough to give the general idea of how the time period used impacts the confidence. What this doesn't do is show when the trend becomes statistically significant - you don't start seeing that until somewhere around the mid eighties or so. That's why using 30 years is a pretty good rule of thumb.
Makes you think the world is in for a record setting cold winter right?
Highly unlikely.
According to Dr. Roy Spencer the UAH satellite data showed last January was:
... the warmest January in the 32-year satellite-based data record.
http://www.drroyspencer.com/2010/02/january-2010-uah-global-temperature-update-0-72-deg-c/
Huh?
The reason for this apparent disconnect is that while it was indeed very cold in some parts of the world, it was also very warm in others:
(RSS MSU satellite anomalies for 01/2010).
You can see how high pressure over the arctic "pushed" cold air down to parts of the US, Europe and Russia, but was replaced by warmer air in the arctic. Much of the rest of the world was much warmer as well.
Does this put a damper on the "skeptics" claims that the last 10 years or so show cooling, that global warming has stopped or that we are headed for another ice age? Well, sorta, but it was a flawed argument to begin with - the time frame is too short to determine the long trend from the short term variation (as I have said many times here). Likewise, jump in January temps (and the increases through 2009 as well) do not by themselves say much about the long term trend for the same reason.
To illustrate, here's the trends for UAH with the 95% statistical confidence ranges. This is a plot of the trends and conf. ranges for each month to the last UAH value (12/1978 to 01/2010, 01/1979 to 01/2010 and so on). What this shows is that the shorter the time frame, the greater the uncertainty of the trend - and the trend gets wilder too. For 11/2009 to 01/2010 the trend was a whopping 13.62 C per decade (133 C per decade - we're gonna fry!) but the uncertainty puts the range anywhere between -25 C per decade (we're gonna freeze!) and 52 C per decade (we're gonna fry really fast!).
I put that together pretty quick and it doesn't take many things into account that would make it more accurate like accounting for autocorrelation and removing sources of noise like ENSO and volcanoes, but it's good enough to give the general idea of how the time period used impacts the confidence. What this doesn't do is show when the trend becomes statistically significant - you don't start seeing that until somewhere around the mid eighties or so. That's why using 30 years is a pretty good rule of thumb.